The Global Impact of Digitisation
How do we shape our digital futures?
The Infrastructure behind Tech
The digital space is immaterial – we cannot physically move through it. Our access points are limited to tangible technologies like smartphones and laptops. We rarely see the aftermath of what we do in the digital space. Yet it has tangible and far reaching environmental, economic and social effects worldwide.
When you scroll through a feed, stream a movie or run an AI prompt, you are relying on energy intensive networks and data centres, global supply chains and mining operations. This includes servers processing data in real time, the electricity powering them, and the rare earth minerals inside your devices. Each action linked to technology - charging your phones, sending a message, uploading a file – activates a sequence of operations that mobilises global infrastructures: power grids, mining operations, manufacturing and shipping routes.
Infrastructures that allow for technology to work seamlessly are everything but intangible. More than 1.3 million kilometres of undersea fibre-optic cables, countless relay stations and more than 8000 data centres globally maintain this digital environment (TeleGeography, 2023; Synergy Research Group, 2023). This digital web covers the Earth like a nervous system: fast, hidden and energy-hungry.
Data centres are hubs of energy consumption. They not only require a constant supply of electricity to run servers 24/7, but they also produce immense amounts of heat. This requires energy-intensive cooling systems. Data centres alone consume between 1 and 1.5% of the world’s electricity, a number that is expected to rise to 4% by 2030 (IEA, 2023).
Some facilities now use water-based cooling systems, which can consume millions of litres per day. In regions prone to drought, this has sparked some serious concerns. In 2022, a Google data centre in The Dalles, Oregon, was revealed to use up to 1.25 billion litres of water annually (Oregonian, 2022). This revelation sparked protests amongst residents and farmers struggling with the consequences of annual droughts.
What powers all this infrastructure? Behind every screen lies a supply chain that stretches across the globe and deep into the ground.
Extraction and Inequality
“AI is not artificial at all; it is made from natural resources, fuel, human labor…” Kate Crawford, Atlas of AI (2021)
This insight captures a core paradox: the most abstract technologies depend on the most physical of extractions.
Our devices and digital infrastructure are made from materials extracted in often deeply unequal and dangerous conditions, particularly in resource rich but economically marginalised regions (Parrique, 2022). The Democratic Republic of Congo supplies over 70% of the world’s cobalt: a key component of lithium-ion batteries, which power most of our rechargeable devices. In the DRC, USGS reports that cobalt is mostly mined by hand in dangerous and poorly regulated conditions (USGS, 2023). These artisanal mining practices expose workers, many of whom are children, to toxic dust, landslides, and exploitative wages (Amnesty International, 2016). In the Atacama Desert of Chile, lithium extraction has contributed to aquifer depletion - draining groundwater faster than it can be naturally replenished. This has serious consequences for local populations and ecosystems (IEA, 2022).
These raw materials are then transported to be transformed and assembled, which combines high emissions from transport and factories. Most of high-end digital technologies are then sold in the so-called ‘Global North’. 80% of high-tech products are consumed in the Global North (OECD, 2020). This highlights a global asymmetry where countries and people who experience vulnerable economic and climatic environments are supplying production chains for more prosperous countries, enhancing risks on fragile environments and public health.
Dominique Boullier from Science Po, highlights « Le numérique repose sur une chaine d’approvisionnement profondément inégalitaire. » (which I translate as “the digital relies on a deeply inequitable supply chain”)
Once devices are assembles, the geography of the cloud starts to take shape into servers and data centres.
Where the Cloud touches the Earth
Shaping global inequalities
A majority of hyperscale data centres are located in the US, and Northern Europe (Synergy Research Group, 2023), reflecting patterns of energy availability, regulatory stability and demand. These are regions with strong digital demand that also offer relatively stable climates and governance – key conditions for sustaining expensive, energy demanding, digital infrastructures.
The Irish Times reported in 2022 that Ireland had to slow its approval of new data centres because they were consuming up to 18% of the country’s electricity grid. Ireland’s grid regulator warned that by 2030, data centres could consume nearly a third of the grid (Commission for Regulation of Utilities, Ireland, 2021).
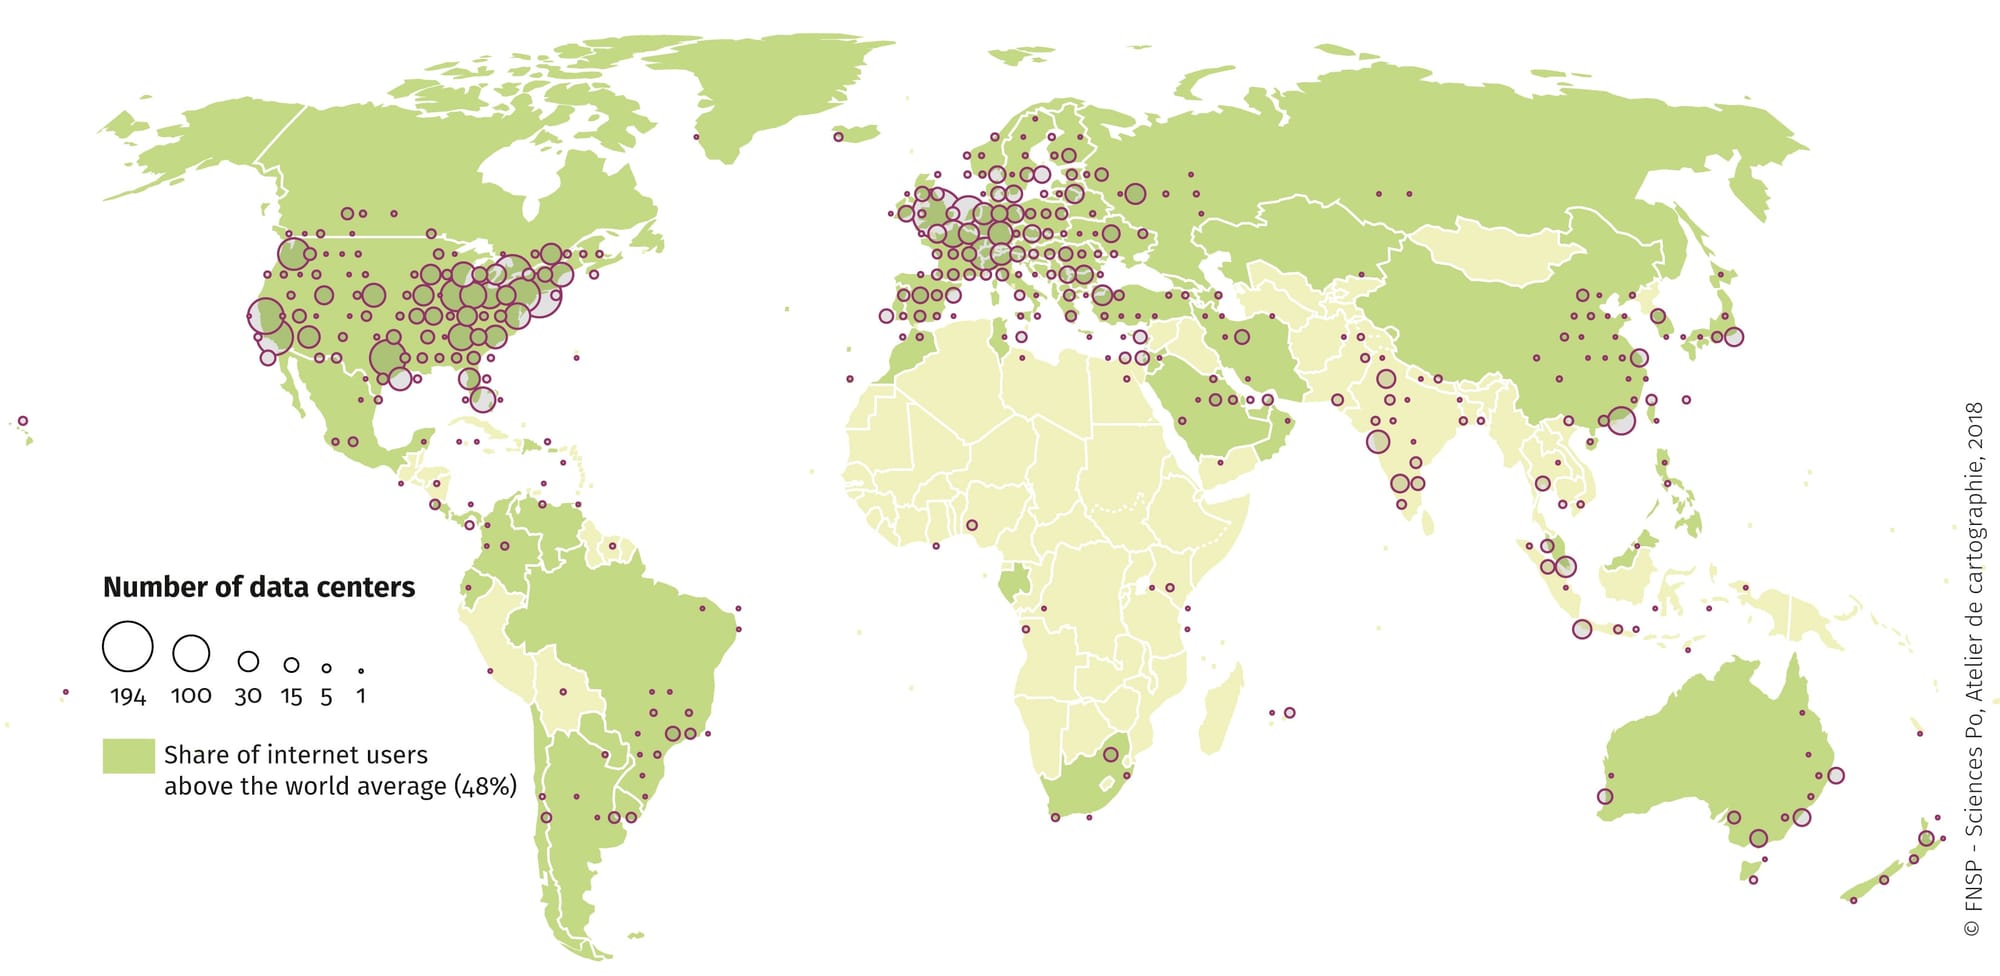
This map, from the Atelier of Cartographie at Sciences Po, clearly shows a concentration of data centres in the US and in Europe. This spatial concentration reinforces digital sovereignty in the North, while externalising environmental costs elsewhere (Hogan, 2015).
Manon Loisel from The Shift Project « Le cloud, ce n’est pas dans les airs: c’est dans les entrepôts climatisés », (translates to: “the cloud is not floating in the air, it sits in air-conditioned warehouses”).
The impact of infrastructures such as data centres does not stop at the local scale, they ripple into environmental, social and political effects.
Ripple effects
Global Emissions, Uneven Consequences
Climate change works as a global feedback loop. Crucially, the areas driving emissions are often far from those that suffer their worst effects.
“Vulnerability is highest in locations and communities with poverty, governance challenges, and limited access to services.” (IPCC AR6 Synthesis Report, 2023)
A 2021 study by the UN Environment Programme showed that the wealthiest 10% of the global population account for over 50% of emissions, while the poorest 50% only contributes 7% of global emissions (UNEP Emissions Gap Report, 2021). This inequality is not accidental – it reflects a global system where high-consumption lifestyles in wealthier regions are underpinned by disproportionate environmental burdens elsewhere.
Although a vast majority of emissions linked to sustaining digital systems are produced in emissions-intensive countries, their consequences are planetary and disproportionately impacts already vulnerable regions to climate hazards. As geographer Diana Liverman notes “climate change impacts are unevenly distributed and are generally greater for disadvantaged people and communities in all countries” (Liverman, 2015).
Digital emissions, although often released far from these regions, contribute to global warming and the cascading risks it generates, from glacial melt in the Arctic to disrupted agricultural economies and ecosystem collapse.

Yet, the planet is not the only concern regarding increased emissions linked to digitisation, it also affects systems of human governance, many of which remain invisible.
“Automating Inequality” Lessons from Virginia Eubanks
Just as digital systems depend on physical infrastructure, they also carry the weight of social infrastructure – coding existing inequalities into software, systems and algorithms. The process of automation of services and platforms can translate existing forms of bias into digital systems.
As Virginia Eubanks argues in Automating Inequality (2018), these infrastructures have become what she calls “digital poorhouses”: digital systems that “profile, police and punish the poor”. This metaphor draws on the 19th century poorhouse system, where the poor were institutionalised and surveilled, she builds on the image to show how modern automated systems pursue this discrimination. In her study, she shows how the digitisation of welfare eligibility systems in the US have exacerbated inequality. Decisions once made by humans are now buried in opaque algorithms, creating systems where errors or biases may be coded into software and go unchallenged.
In 2015, an automated eligibility system in Indiana led to the wrongful termination of benefits for over one million people, often without notice or explanation (Eubanks, 2018) This is not just a glitch in the system – it is systematic reshaping of governance, where opacity gets in the way of accountability.
Together, these threads reveal that the digital is inseparable from the physical and the political. Nonetheless our digital footprints pile up, even when we dispose of devices. E-waste tells a powerful story about who pays the price of digitisation.
The Legacy of Technology
More than 50 million tonnes of e-waste are produced annually, yet only about 17,4% is formally collected and recycled (UNEP, 2022). The rest often ends up dumped, burned, or informally processed under hazardous conditions.
“E-waste is a growing global challenge that poses a serious threat to the environment and human health worldwide” warns Stephan Sicard, an environmental director at the UN Industrial Development Organization.
In Ghana, the Agbogbloshie dump in Accra is one of the largest e-waste dumps in the world. Every year, thousands of tonnes of discarded electronics – primarily from Europe and North America- arrive there. Workers, including children, disassemble and burn components to extract copper and other valuable metals, often without protective equipment. This process releases toxic substances, including lead, dioxins and mercury, into the local environment. Studies documented severe health impacts, including respiratory issues, and elevated blood lead levels in children. Brigden et al., Greenpeace 2008; Akormedi et al., 2013; Grant et al., WHO, 2015).
This feeds into the feedback loop where digital innovation and consumption in pre-industrialised regions contributes to the accumulation of toxic waste and pollution in vulnerable regions increasing health and environmental risks. But before our devices reach end-of-life, they are powered by spatial infrastructures shaped by politics and economics.
All of this brings us to the conclusion: digitisation not only exists into the digital, it is wired into global environmental and social systems.
Reckoning with the Invisible
Digital is Physical: what shapes our digital futures?
The digital world appears as fast, clean, and immaterial – as if our messages float through the air - but its existence is deeply grounded in the physical world. What we call “the cloud” is in fact rooted in planetary systems: from extraction of natural resources to energy grids, heat emissions and waste flows. Think of it as a material lifecycle: mined - manufactured - powered - discarded.
The French geographer Frédéric Durand remarks « la révolution numérique a reconfiguré la géographie des inégalités, elle ne les a pas effacées. », which can be translated as “digital revolution reshaped the geography of inequalities, it did not erase them”.
Let us pull it together. Digitisation is not inherently bad, but it is built on energy systems that impact natural, environmental systems and human lives.
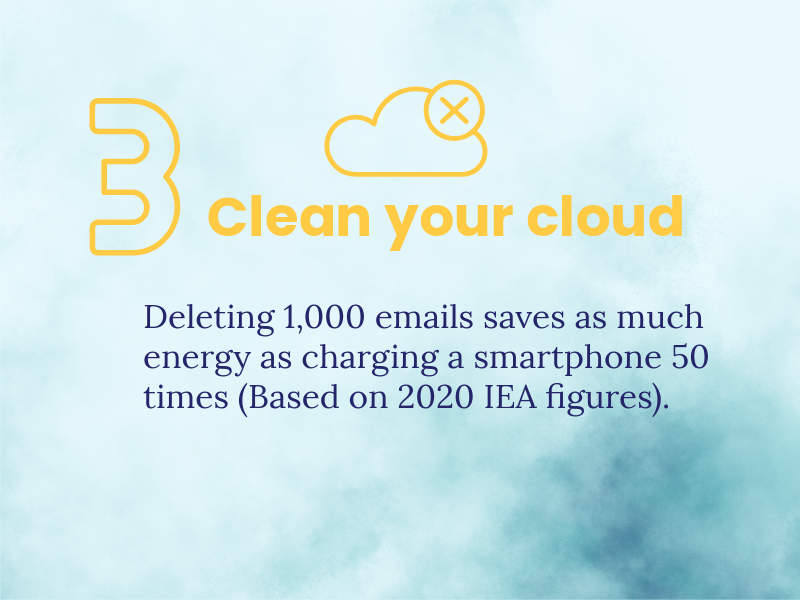
Manage your digital impact - 5 key tips
Small and sustained actions matter.


Learn More:

More from the International Energy Agency - Report on Critical Minerals & from The Shift Project - Publications
Quoted here:
- Amnesty International (2016) This is What We Die For. Available at: https://www.amnesty.org
- Akormedi, M., Asampong, E. and Fobil, J.N. (2013) ‘Working conditions and environmental exposures among electronic waste workers in Ghana’, International Journal of Occupational and Environmental Health, 19(4), pp. 278–286.
- Brigden, K., Labunska, I., Santillo, D. and Johnston, P. (2008) Chemical Contamination at E-Waste Recycling and Disposal Sites in Accra and Korforidua, Ghana. Greenpeace.
- Christensen, T.R. et al. (2022) ‘Thawing permafrost: science, impacts and policy challenges’, Nature Reviews Earth & Environment, 3(3), pp. 198–214.
- Commission for Regulation of Utilities (2021) Electricity and Gas Networks Performance. Dublin: CRU.
- Crawford, K. (2021) Atlas of AI. Yale University Press.
- Durand, F. (2020) ‘La révolution numérique et les inégalités’, Annales de Géographie, 729(5), pp. 20–35.
- Eubanks, V. (2018) Automating Inequality: How High-Tech Tools Profile, Police, and Punish the Poor. St. Martin’s Press.
- Google/Stanford (2021) Google Environmental Report. Google Inc.
- Grant, K. et al. (2015) ‘Health consequences of exposure to e-waste’, The Lancet Global Health, 3(12), pp. e701–e710.
- Hogan, M. (2015) ‘Data flows and digital sovereignty’, Big Data & Society, 2(2).
- IEA (2022) Global EV Outlook. International Energy Agency.
- IEA (2023) Electricity 2023: Analysis and Forecast to 2025. IEA.
- IPCC (2019) Special Report on the Ocean and Cryosphere in a Changing Climate. Intergovernmental Panel on Climate Change.
- IPCC (2023) AR6 Synthesis Report: Climate Change 2023. Geneva: IPCC.
- Jouzel, J. (2018) CNRS Climate Series [Interview].
- Liverman, D. (2015) ‘Geographic perspectives on development and climate change’, Geographical Journal, 181(2), pp. 115–125.
- Loisel, M. (2020) Le cloud n’est pas dans les airs, The Shift Project.
- Mayer, A.L. (2019) ‘Cold data: Climate, data centres and the Arctic’, Geoforum, 103, pp. 10–12.
- Maslin, M. (2014) Climate Change: A Very Short Introduction. 3rd edn. Oxford University Press.
- NSIDC (2023) Permafrost Overview. National Snow and Ice Data Center.
- OECD (2020) High-Tech Exports Indicator. OECD Data. Available at: https://data.oecd.org
- Oregonian (2022) ‘Google’s Data Center Water Use Spurs Drought Protests’. The Oregonian, 18 Oct.
- Parrique, T. (2022) The Political Economy of Degrowth. Available at: https://timotheeparrique.com
- Rantanen, M. et al. (2022) ‘The Arctic has warmed nearly four times faster than the globe since 1979’, Communications Earth & Environment, 3(1).
- Synergy Research Group (2023) Global Data Center Trends. Available at: https://www.srgresearch.com
- TeleGeography (2023) Submarine Cable Map. Available at: https://www.submarinecablemap.com
- UNEP (2022) Global E-waste Monitor. United Nations Environment Programme.
- UNEP (2021) Emissions Gap Report 2021. United Nations Environment Programme.
- USGS (2023) Mineral Commodity Summaries: Cobalt. United States Geological Survey.